| |
The
"Digging" Report July
20, 1999 |
|
"The most powerful force
in the world is Compound Interest", Albert Einstein.
For all
of you that had read my essay The Prison
and are curious about what I am doing about it; I had posted this page where I
will report the progress of my efforts to escape from the prison.
As I
said before; I will avoid posting very specific details of my personal
finances; therefore don't expect to see how much I am investing. However, due
to the nature of the method employed in accounting you will be able to see
numbers that you can track. I found this method on The Motley Fool Drip
portfolio; it is called the shares approach; and while I am not going to
explain it in detail here let me paint a quick draft about it:
The
fundamental problem when tracking dollar cost averaging investments is how to
give equal weight to the amounts invested regardless of their timing. The boys
at TMF found an interesting way called the shares approach. Basically it
consist of setting up a "Mutual Fund" where you start with a certain
amount of money and you determine arbitrarily the initial share price. Lets
say that you will start your investment with 1,000 and you will set an initial
share price of 10.00. You will start your "fund" with 1000/10 = 100
shares and you will use the money to open a savings account, a bank CD, buy a
mutual fund, bonds, stocks, etc. At each given day the Net Asset Value (NAV)
of your "fund" will be the total value of your portfolio divided by
the number of "shares". Every time you add more money to your
"fund" you purchase additional "shares" at the "NAV"
of that day (at market closing time).
For a
complete explanation about this procedure check The Motley Fool The Drip Portfolio -- Accounting for Drips
|
|
My
Personal "Mutual Fund" OTC:RASXX
Note:
OTC means Over The Counter. The ticker symbol is fictitious; please don't ask
your broker to buy it. In the rare event that such a ticker does exist please
inform me at once, in order to change it. I don't want to mislead anyone. |
|
I
started my "fund" in October 21, 1996. The Honduran financial
markets don't offer the abundance that the US market does; so, I started with
a US currency "capitalization fund"; an automatic investment plan in
which you agree to deposit a specific amount on a monthly basis. Your
principal is guaranteed by the bank and they pay an interest rate equal to the
US prime rate; that's
higher than US Treasury bills and US bank CD's. However the maturity is 10
years.
In
March 5, 1999 I started to invest in the US market and with that the
volatility factor started to reflect into my "fund" (see the YTD
graph); but also the potential for faster growth also started to work.
I set
an initial share price of 10.00. The number of shares in my fund wont be
posted to preserve the privacy of my portfolio value. However, using the 7%
criteria described in Freedom Stage 1 The Great Tunnel I will post the ratio
between my portfolio buying power and my average monthly salary. Technically
speaking I should use my monthly living expenses instead of my wages; but
because at present time "There is too much month at
the end of my money", I will be using my salary as a reference for
a while. The
performance of the "fund" will be based on the "NAV" and
will be posted on a quarterly basis and will be measured against the S&P
500. The dollar cost averaging method hardly can beat the S&P 500 and if
we take into account that for more than 2 years I only had a low yielding
investment option; the evident disparity between the index and my
"fund" performance is less worrying. My goal now is to start
closing the gap using the knowledge and options I have at my reach today. |
|
Performance
as of 7/20/1999
NAV:
15.94
|
|
RASXX |
S&P
500 |
|
YTD
as of 7/20/1999 |
5.03% |
12.03% |
|
1
Year |
11.33% |
16.04% |
|
3
Years |
--- |
--- |
|
5
Years |
--- |
--- |
|
10
Years |
--- |
--- |
|
Since
Inception (10/21/1996) |
*18.51% |
*27.30% |
*
Annualized compound return
The 1,
3, 5 and 10 year periods are counted backwards starting from the report date
Performance
is before personal taxes. Maintenance and research costs (my personal time
doing the accounting, trading and web publishing; time spent on the web and
investment books) are not taken into consideration.
Freedometer
ratio: 0.97%
Scale:
0-10 Worthless slave; 11-25 Rank and file; 26-40 Lowest level privileged;
41-75 Candidate for temporal release; 76-99 Almost free on parole; 100+ § A
free person!
§
Unless you can't make ends meet with your present salary.
|
|
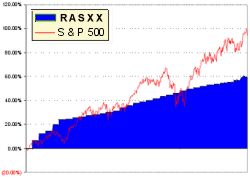
Since
Inception |
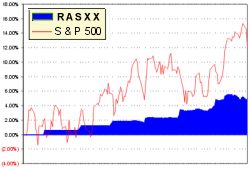
Year
to date |
| According to
Robert Kiyosaky, it is possible for mere mortals like you and me to achieve
financial freedom in 20 years. I still have over 17 years, and you? Never is
too late to start; Colonel Sanders started over again when he was in his 60's.
We CAN do it!!! |
|
Up |
|